Результат поиска по запросу: "statistical20representation"

Financial statistics documents ball pen infographics
favorite
Коллекция по умолчанию
Коллекция по умолчанию
Создать новую
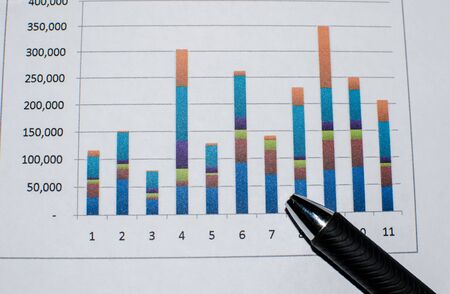
Financial graphs analysis and pen.
favorite
Коллекция по умолчанию
Коллекция по умолчанию
Создать новую
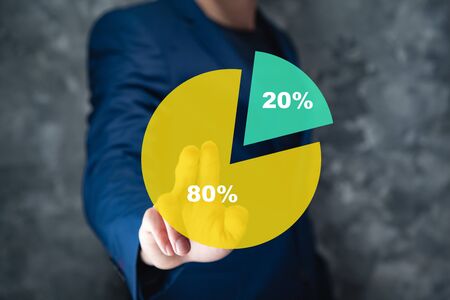
businessman touching pie chart in screen
favorite
Коллекция по умолчанию
Коллекция по умолчанию
Создать новую
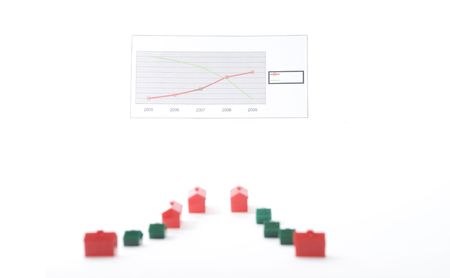
in the news today the failing housing industry
favorite
Коллекция по умолчанию
Коллекция по умолчанию
Создать новую

statistic bars. High quality photo
favorite
Коллекция по умолчанию
Коллекция по умолчанию
Создать новую
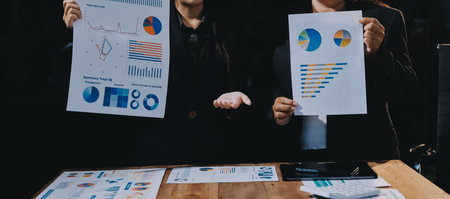
Business analyze,Close up Business people meeting to discuss the situation on the market. Business Financial Concept
favorite
Коллекция по умолчанию
Коллекция по умолчанию
Создать новую

Winning the business race concept with blue pawn beating red pawns on white
favorite
Коллекция по умолчанию
Коллекция по умолчанию
Создать новую
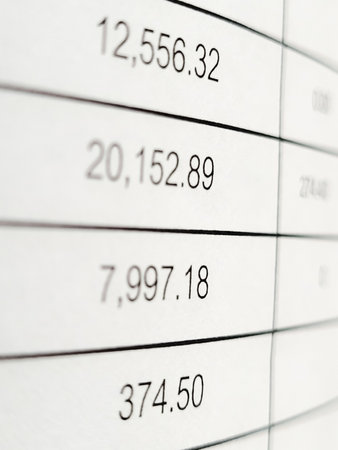
Financial documents or report sheet
favorite
Коллекция по умолчанию
Коллекция по умолчанию
Создать новую

Number Grid for Educational Purposes
favorite
Коллекция по умолчанию
Коллекция по умолчанию
Создать новую

Mathematical education concept of function, integral, derivative formulas
favorite
Коллекция по умолчанию
Коллекция по умолчанию
Создать новую
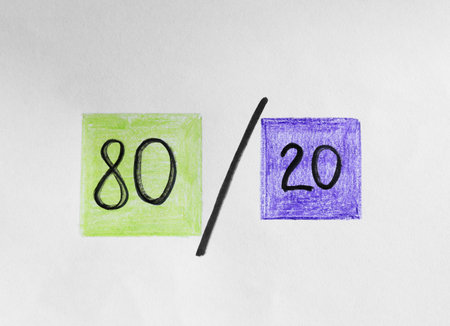
80/20 rule representation on white background. Pareto principle concept
favorite
Коллекция по умолчанию
Коллекция по умолчанию
Создать новую

Chart and Pencil
favorite
Коллекция по умолчанию
Коллекция по умолчанию
Создать новую
Business graph and chart on table. Business and finance concept. 3D Rendering
favorite
Коллекция по умолчанию
Коллекция по умолчанию
Создать новую
Recession text and graph with stats going down in front of Christmas tree with decorations, concept of the post pandemic economy in witner 2022
favorite
Коллекция по умолчанию
Коллекция по умолчанию
Создать новую

The sleek, illuminated bar graph displays data trends on a glossy table in a contemporary office environment at night, highlighting growth and analysis.
favorite
Коллекция по умолчанию
Коллекция по умолчанию
Создать новую
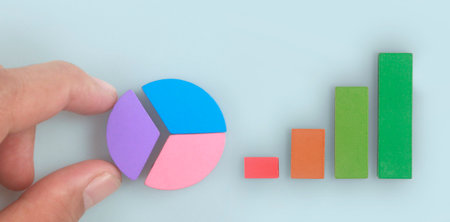
Business connecting piece of multi colored pie chart in a hand
favorite
Коллекция по умолчанию
Коллекция по умолчанию
Создать новую
New 2013 year card High resolution image 3d rendered illustration
favorite
Коллекция по умолчанию
Коллекция по умолчанию
Создать новую

Sport winner podiums set. Isometric and 2d illustration.
favorite
Коллекция по умолчанию
Коллекция по умолчанию
Создать новую
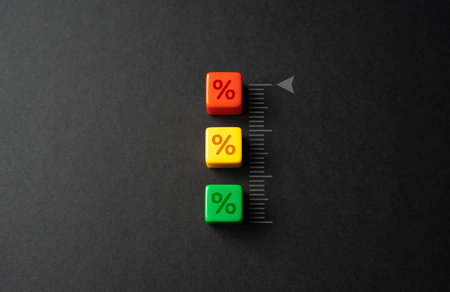
The highest interest rate on the deposit. High tax burden or income levels, progressive scale of taxation. Personal finance, taxation policy, and investment strategies.
favorite
Коллекция по умолчанию
Коллекция по умолчанию
Создать новую

Business and Technology target set goals and achievement in 2023 new year resolution statistics graph rising revenue, planning to start up strategy, icon concept
favorite
Коллекция по умолчанию
Коллекция по умолчанию
Создать новую

Visual representation of trade analytics graphs and charts analyzing global market trends
favorite
Коллекция по умолчанию
Коллекция по умолчанию
Создать новую
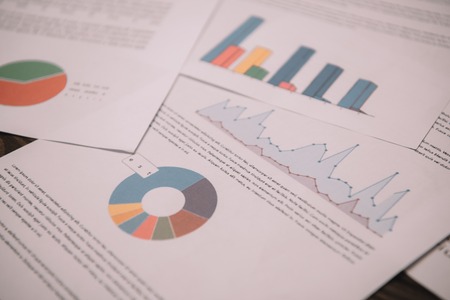
close up of business documents with graphs and charts for strategy
favorite
Коллекция по умолчанию
Коллекция по умолчанию
Создать новую

a box with neon lights displaying a number, featuring a realistic and detailed rendering reminiscent of 20th-century art. the image showcases lens flares, indicating a vibrant and dynamic composition. this captivating artwork, a contest winner, highlights the use of glass as a material, with a striking combination of light red and azure colors. the realistic usage of light and color adds depth and visual appeal
favorite
Коллекция по умолчанию
Коллекция по умолчанию
Создать новую
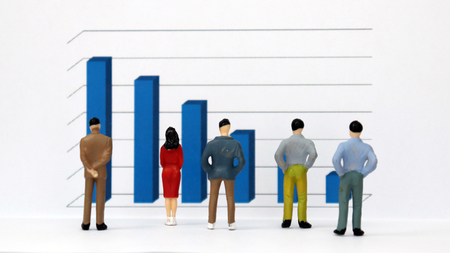
3D bar graphs and miniature people. Miniature people looking at the same place.
favorite
Коллекция по умолчанию
Коллекция по умолчанию
Создать новую
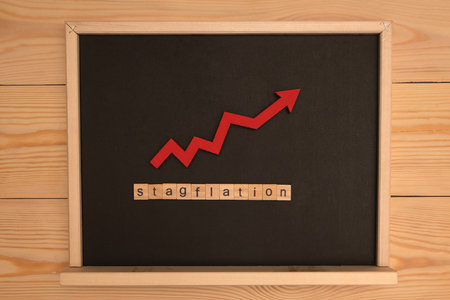
Word stagflation assembled from wooden letters game and red arrow on black school chalkboard
favorite
Коллекция по умолчанию
Коллекция по умолчанию
Создать новую

3d render A series of black bars are stacked on top of each other
favorite
Коллекция по умолчанию
Коллекция по умолчанию
Создать новую
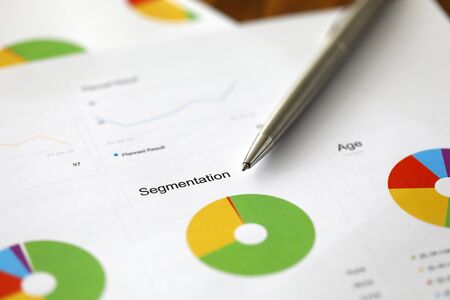
Pen lie on the paper document with business strategy chart against office table background. Slice database concept.
favorite
Коллекция по умолчанию
Коллекция по умолчанию
Создать новую

Close up 3d render of business graph with orange and blue bar charts on table and blurred background
favorite
Коллекция по умолчанию
Коллекция по умолчанию
Создать новую

The wooden doll represents the employee of the company line up on business graph in workplace and them represents new employee, search job or job career. Corporation, Enterprise concept.
favorite
Коллекция по умолчанию
Коллекция по умолчанию
Создать новую

Chart, graph and info graphics 3d design for data analysis, seo tools or statistics background
favorite
Коллекция по умолчанию
Коллекция по умолчанию
Создать новую
Statistics Research Report Data Information Chart Concept
favorite
Коллекция по умолчанию
Коллекция по умолчанию
Создать новую
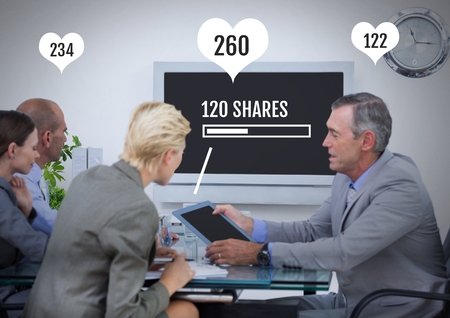
Digital composite of Business people working on tablet with Shares and likes status bars at meeting
favorite
Коллекция по умолчанию
Коллекция по умолчанию
Создать новую

This close-up photograph showcases a paper with numerous dots in varying sizes and positions, A scatter plot showing risk vs return for various investments, AI Generated
favorite
Коллекция по умолчанию
Коллекция по умолчанию
Создать новую
analyzing report, business performance concept
favorite
Коллекция по умолчанию
Коллекция по умолчанию
Создать новую

3d representation of a blue bar graph with data visualization on a dark background
favorite
Коллекция по умолчанию
Коллекция по умолчанию
Создать новую

Businessman or investor or fund manager planning to diversify risk and asset allocation and portfolio management in stock market
favorite
Коллекция по умолчанию
Коллекция по умолчанию
Создать новую

Business planning Systematic work Links and Communications Unity in working as a successful business team
favorite
Коллекция по умолчанию
Коллекция по умолчанию
Создать новую

Glowing Futuristic Number 20 A 3D Render for Technology, Digital Art, and Innovation
favorite
Коллекция по умолчанию
Коллекция по умолчанию
Создать новую
Data charts on the lcd monitor (selective and soft focus)
favorite
Коллекция по умолчанию
Коллекция по умолчанию
Создать новую

Group of confident business people point to graphs and charts to analyze market data, balance sheet, account, net profit to plan new sales strategies to increase production capacity.
favorite
Коллекция по умолчанию
Коллекция по умолчанию
Создать новую
Bar Chart Graph Marketing Profit Improvement Sales Concept
favorite
Коллекция по умолчанию
Коллекция по умолчанию
Создать новую

Close up push pin selecting a date on the calendar
favorite
Коллекция по умолчанию
Коллекция по умолчанию
Создать новую
Business graph background: Analysis business accounting on info sheets.
favorite
Коллекция по умолчанию
Коллекция по умолчанию
Создать новую

financial charts and graphs on the table
favorite
Коллекция по умолчанию
Коллекция по умолчанию
Создать новую

Colorful Bar Graph Depicting Business Growth and Success on Digital Tablet With Defocused Background
favorite
Коллекция по умолчанию
Коллекция по умолчанию
Создать новую
graph chart of stock market investment trading.
favorite
Коллекция по умолчанию
Коллекция по умолчанию
Создать новую

Primes
favorite
Коллекция по умолчанию
Коллекция по умолчанию
Создать новую

Charts Graphs paper. Financial development, Banking Account, Statistics, Investment Analytic research data economy, Stock exchange Business office company meeting concept.
favorite
Коллекция по умолчанию
Коллекция по умолчанию
Создать новую
Charts Graphs spreadsheet paper. Financial development, Banking Account, Statistics, Investment Analytic research data economy, Stock exchange Business office company meeting concept.
favorite
Коллекция по умолчанию
Коллекция по умолчанию
Создать новую

Wooden building blocks toy with shadow isolated on yellow background.
favorite
Коллекция по умолчанию
Коллекция по умолчанию
Создать новую

Image of financial data processing over cityscape. Global finance, business, connections, computing and data processing concept digitally generated image.
favorite
Коллекция по умолчанию
Коллекция по умолчанию
Создать новую
Detailed bar charts and graphs illustrate data trends and statistics across various categories, highlighting important information for analysis in a research or business context.
favorite
Коллекция по умолчанию
Коллекция по умолчанию
Создать новую
Image of statistics and financial data processing over globe. global business, digital interface, technology and networking concept digitally generated image.
favorite
Коллекция по умолчанию
Коллекция по умолчанию
Создать новую

Selective focus on detail of euro banknotes. Close up macro detail of money banknotes, 20 euro isolated. World money concept, inflation and economy concept
favorite
Коллекция по умолчанию
Коллекция по умолчанию
Создать новую

New business people in the conference room are exchanging information with each other along with rehearsing important information before presenting work and new projects to the management team
favorite
Коллекция по умолчанию
Коллекция по умолчанию
Создать новую

Shot of a asian young business Female working on laptop in her workstation.
favorite
Коллекция по умолчанию
Коллекция по умолчанию
Создать новую
Graphical representation of ai system development and business growth analytics for success
favorite
Коллекция по умолчанию
Коллекция по умолчанию
Создать новую

Goal business success strategy chart target and planning. Stock market, Business growth, progress or success. Stock market graph financial profit stock market development.
favorite
Коллекция по умолчанию
Коллекция по умолчанию
Создать новую
financial documents with magnifying glass over them
favorite
Коллекция по умолчанию
Коллекция по умолчанию
Создать новую

Working team meeting concep graph financial with social network diagram discussing data analysis data the charts and graphs
favorite
Коллекция по умолчанию
Коллекция по умолчанию
Создать новую

Business people analyzing investment charts with laptop in meeting room. Business and financial concept. ai generated
favorite
Коллекция по умолчанию
Коллекция по умолчанию
Создать новую
Bar Graph Analysis Achievement Improvement Strategy Success Concept
favorite
Коллекция по умолчанию
Коллекция по умолчанию
Создать новую

Pie chart with world map
favorite
Коллекция по умолчанию
Коллекция по умолчанию
Создать новую

Man made of wood with a falling graph. Global financial crisis. The performance of the team is deteriorating. The readiness of the team that is going into recession.
favorite
Коллекция по умолчанию
Коллекция по умолчанию
Создать новую

startup business, business advisor leadership for planning finance investment teamwork paperwork audit and discussing marketing, profit, budget of company in meeting room
favorite
Коллекция по умолчанию
Коллекция по умолчанию
Создать новую

A detailed view of a paper displaying a bar chart, illustrating data trends and comparisons, A graph that represents the risk and reward ratio of a certain investment, AI Generated
favorite
Коллекция по умолчанию
Коллекция по умолчанию
Создать новую

Goal setting and planning for 2026. New Year resolution. Hand adjusting wooden blocks to display the year 2026, with target icon symbolizing goal setting and strategic planning for the upcoming year.
favorite
Коллекция по умолчанию
Коллекция по умолчанию
Создать новую
Chart graph paper. Finance, account, statistic, investment data economy, stock exchange business.
favorite
Коллекция по умолчанию
Коллекция по умолчанию
Создать новую
Image of financial data processing over diverse business people in office. Global finance, business, connections, computing and data processing concept digitally generated image.
favorite
Коллекция по умолчанию
Коллекция по умолчанию
Создать новую
Close of business workplace with financial reports and office stuff
favorite
Коллекция по умолчанию
Коллекция по умолчанию
Создать новую
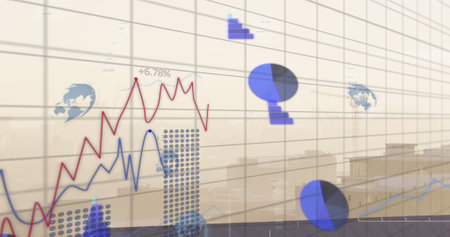
Image of data processing over cityscape. Global technology, computing and digital interface concept digitally generated image.
favorite
Коллекция по умолчанию
Коллекция по умолчанию
Создать новую

Market share increase concept above the hands of a man in background
favorite
Коллекция по умолчанию
Коллекция по умолчанию
Создать новую

wood blocks stacking as step stairs. success and development concept
favorite
Коллекция по умолчанию
Коллекция по умолчанию
Создать новую

Business people having a discussion while working with charts and drawings on the glass wall in the office
favorite
Коллекция по умолчанию
Коллекция по умолчанию
Создать новую

Medical marketing and Health care business analysis report. Medical marketing concept
favorite
Коллекция по умолчанию
Коллекция по умолчанию
Создать новую
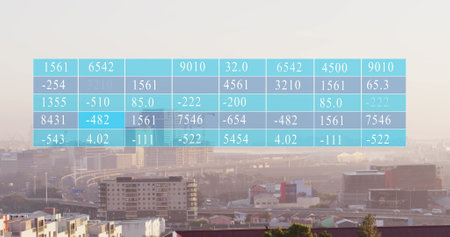
Image of numbers in table over modern cityscape against sky. Digital composite, multiple exposure, business, digits, abstract, buildings and architecture concept.
favorite
Коллекция по умолчанию
Коллекция по умолчанию
Создать новую

Finance business graph on a chalkboard
favorite
Коллекция по умолчанию
Коллекция по умолчанию
Создать новую
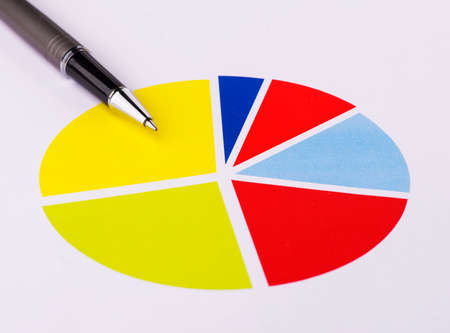
business financial chart analysis with pen
favorite
Коллекция по умолчанию
Коллекция по умолчанию
Создать новую

Business People Meeting Brainstorming Planning Teamwork Concept in modern office. ai generated
favorite
Коллекция по умолчанию
Коллекция по умолчанию
Создать новую
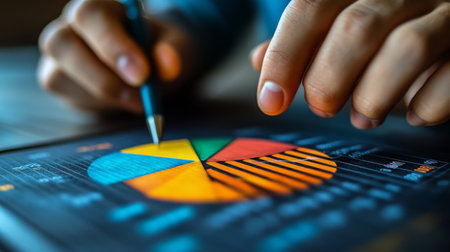
A business professional uses a hand to interact with a colorful pie chart displaying financial metrics in an office setting. The atmosphere is focused and analytical.
favorite
Коллекция по умолчанию
Коллекция по умолчанию
Создать новую
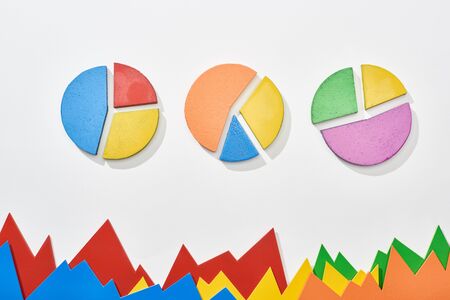
top view of multicolor statistic graphs and pie charts on white background
favorite
Коллекция по умолчанию
Коллекция по умолчанию
Создать новую

Photo of young business woman with infographic
favorite
Коллекция по умолчанию
Коллекция по умолчанию
Создать новую

Cropped shot of a people hands working on their project and using charts and sales reports in office. Business professionals meeting in office. Close shot of a diverse company employees hands.
favorite
Коллекция по умолчанию
Коллекция по умолчанию
Создать новую

Simple Illustration Photo,Gruap of Man and Woman doing a Business meeting with graphic Chart as a background
favorite
Коллекция по умолчанию
Коллекция по умолчанию
Создать новую

Speedometer of a car
favorite
Коллекция по умолчанию
Коллекция по умолчанию
Создать новую

Business analyze,Close up Business people meeting to discuss the situation on the market. Business Financial Concept
favorite
Коллекция по умолчанию
Коллекция по умолчанию
Создать новую

A woman and a man on a business lunch in a restaurant. meet the project and data
favorite
Коллекция по умолчанию
Коллекция по умолчанию
Создать новую
Graphs and Charts. Flowcharts. Statistic. Macro. Blue color.
favorite
Коллекция по умолчанию
Коллекция по умолчанию
Создать новую
Old style spreadsheet.
favorite
Коллекция по умолчанию
Коллекция по умолчанию
Создать новую

Close-up of a purchase receipt.
favorite
Коллекция по умолчанию
Коллекция по умолчанию
Создать новую

Team of professional business partners holding pen pointing at financial graph document, calculating analysis and strategy consulting. Meeting, brainstorming at office, teamwork co
favorite
Коллекция по умолчанию
Коллекция по умолчанию
Создать новую
Business growth analytics marketing and statistics closeup
favorite
Коллекция по умолчанию
Коллекция по умолчанию
Создать новую

Image of numbers changing over smiling biracial businessman in office. global business and data processing concept digitally generated image.
favorite
Коллекция по умолчанию
Коллекция по умолчанию
Создать новую
A vibrant pie chart sits prominently in the foreground, surrounded by colorful bar graphs, showcasing statistical data during a business meeting focused on data analysis and decision-making.
favorite
Коллекция по умолчанию
Коллекция по умолчанию
Создать новую

Documents with graphs of statistical reports and colorful stickers hanging on chalkboard in educational business center closeup
favorite
Коллекция по умолчанию
Коллекция по умолчанию
Создать новую

Graphic designer brainstorm and graphic art at busy creative studio workshop. Experiment and brainstorm color palette and pattern at workspace table for creative design. Panorama shot. Scrutinize
favorite
Коллекция по умолчанию
Коллекция по умолчанию
Создать новую

Old tombstone in Italian cemetery with birth and death dates
favorite
Коллекция по умолчанию
Коллекция по умолчанию
Создать новую

Digital interface with data processing against businessman and businessman working in office. Global business networks connections and digital interface concept digitally generated image.
favorite
Коллекция по умолчанию
Коллекция по умолчанию
Создать новую

Financial chart, laptop and tablet on the workplace of a businessman
favorite
Коллекция по умолчанию
Коллекция по умолчанию
Создать новую

young business man hand graph in screen
favorite
Коллекция по умолчанию
Коллекция по умолчанию
Создать новую
Поддержка
Copyright © Legion-Media.


